SL300 User Guide

SL300 is a free software tool for programming SL series of APCS signal conditioning modules.
Please refer to SL300 Install to download.
The user guide may be downloaded here for a quick reference.
This free tool is upgraded with each release of a SL series module. The SL300 Programmer can read and program all parameters for the entire range of Smart Line signal conditioners.
The SL350-20 is the newest berth in the SL family.
SL300 Programmer - User GuideSL303-DS30322-UserGuide-10.pdf
SL345 Program
Main Screen Display
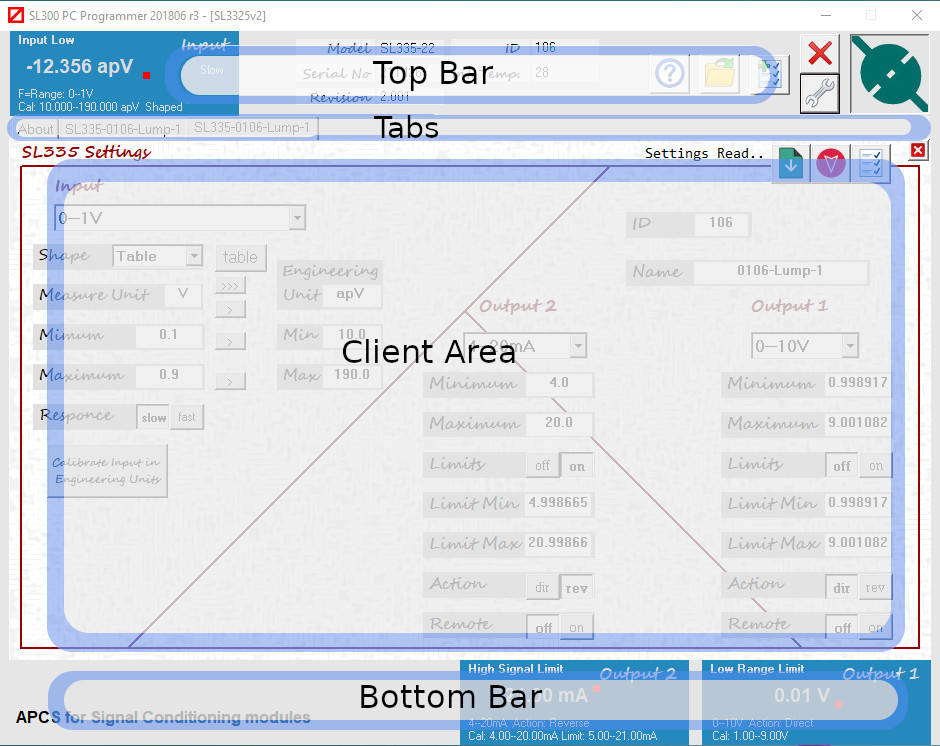
The user interface is broken up into top bar, bottom bar and client area.
The top bar also includes tabs to select between multiple client area programs.
The central client area allows data entry and retrieval of program data.
Top Bar
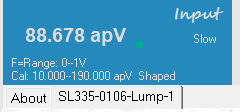
Connected module reading and calibration is displayed on the left hand side.
Under the reading display is the tab bar. The second tab is currently selected.
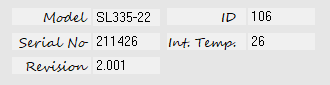
The primary identification of connected module is displayed on the top bar centre. All modules have a unique serial number and calibration constants.
Every time the SL303 is plugged into a different unit the calibration parameters are read again.
The top right has the top bar command icons

Connect to defined com port and read module settings.
When pressed an attempt will be made to read module settings.

Settings..
Select the required port and connector module.

Disconnect from COM port

Open disk file into a new tab. Preview module types available or read previously saved settings.

Read settings from connected module into a new tab.
Client Area
The client area can hold multiple module setting screen using the tab bar. The settings displayed nay or may not be of the currently connected module. The program button will only work if the connected module is of the same type.

Save to File
Save the currently loaded settings into a disk file

Program
Write settings into the currently connected module.

Read
Read settings from connected module into the currently loaded tab. This
will overwrite the setting in the current tab.

Close Tab of close current window. Any changes not written into a module or saved to disk file will be lost.
General Operation
In this section we will follow a typical connection process first time operation. After the initial operation the program will usually start and connect automatically to a connected module.
What is the SL303 and why is it required?
The SL303 is a USB Isolator that provides galvanic isolation, signal and
level translation between your SL series signal conditioning module and
your PC.

We are 99.9% sure that if you connect an SL series module directly to a USB port on your PC or mobile phone no damage either device will occur. Communication will not occur without the SL303 connected. The SL devices are isolators. The SL300 interface connector is in most cases is at the negative input measurement potential. This means that connecting to the unit must be via the SL303. The SL303 provides 2KV isolation, enabling safe operation while the unit is connected to an operating system.
The SL series is used in industrial environments, its +/- input terminals or +/- output terminals may be at elevated voltages to enable your application to work. Servicing on site should only be conducted by qualified personnel that are familiar with the installation.
First Contact
- Install the SL300 software package and USB driver software.
- Connect the supplied cable end A into SL303 and plug the SL303 into the USB port on Windows PC. Leave cable end B loose.
- The windows hardware detection should operate and find hardware USB to serial port. At this stage none of the LED’s are on.
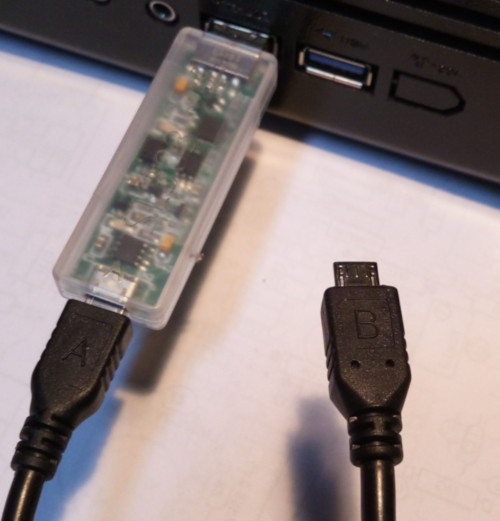
SL303 Connect 1
SL303 Connect 2
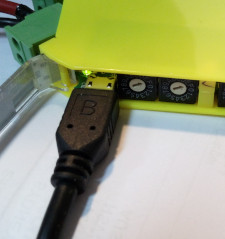
- After hardware detection (slow the first time) connect the loose cable end B into a powered SL series module. The power supplied by the SL series module will illuminate the green LED on the SL303.
- Start the SL300 software. ‘All Programs > APCS > SL300 v2 Programmer’. You will find it in the ‘A section’ of the windows 10 start menu. On startup the program attempt connection or press the connect icon.
If connection is successful basic parameters including part number and serial number will be displayed on the top bar. Continue with section ‘Connection Problem’ or ‘Read SL Module Program’.
Connection Problem
Connection problems are caused by failed USB driver install, incorrect com port selected or client SL module is not powered.
Click the settings icon
Check that the ‘Connector’ is set on SL303-10 (or COA703).

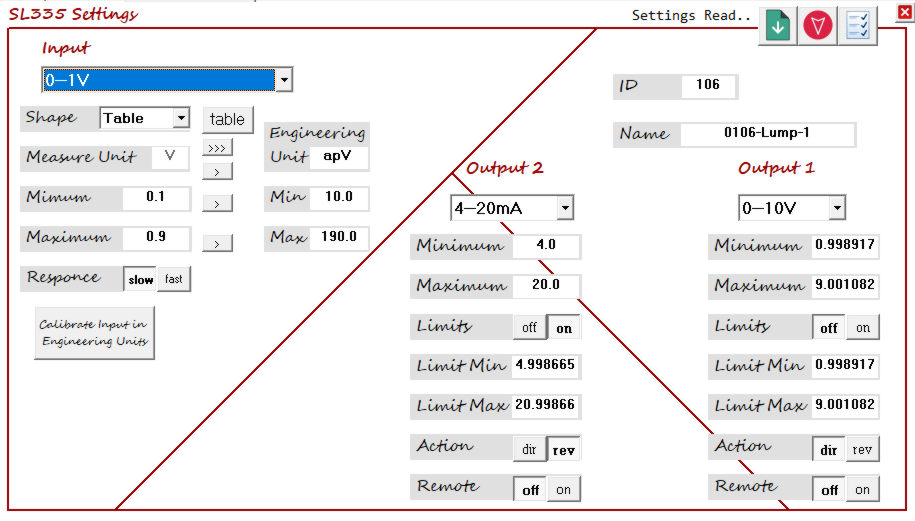
SL300 Settings Screen
Click on the com port drop-down and search for connected SL module.
In this example I selecte COM4.
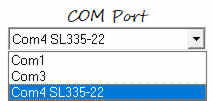
I selected COM4
After selecting the correct COM port press connect on the settings dialogue. Parameters should read and the settings dialogue will close automatically.
If connection fails the dialogue will remain open and display an error message.
- Check that the SL module is powered.
- Press refresh to rebuild the COM port list and look for a connected LS module again.

Read SL Module Program
The top Bar will now display common module details. The top and bottom bar shows information about the currently selected module regardless of which tab is selected.
- On the top bar click ‘Read Settings into a new tab’.
- This will open a new tab in the central programming area and read program from connected module.
- After reading the program data from a module the existing program data can be saved to disk file.
- Program change are entered into the fields on the central screen. Changes to the name parameter will be reflected in the file name if saved again.
- Press program to write changes into the connected SL module.
- Pressing read in the client area will copy settings from the connected module again, any changes you made will be lost tab.
- The close tab button loose any changes not written into a module or saved to disk file.
When programming multiple modules just unplug from the top of the last module and plug into the next. Leave the ‘A end’ of cable connected to the SL303. The B end will be at the same potential as the reference or zero volts input terminal. In most cases this is quite safe depending on your application if in doubt unplug input connectors.
Entry Parameters
Entry parameters vary with the module type connected.
| Input | Select Measurement type / Range or sensor |
| Range | Minimum to maximum of measurement unit. |
| Measurement Unit | Unit of measure that the range is calibrated. |
| Sensor | Input device external to the isolator measuring the parameter. |
| Shape | Linear = Direct relationship between measurement and reading. Table = A correction table is applied to correct errors in the input sensor. |
| Auxiliary | A power supply available to the input terminals used to power the sensor. |
| Loading | Resistance added across measurement terminals to reduce noise or bias inputs. |
| Response | Time taken for input measurement to be reflected in the output. The Fast / Slow response function is input filtering to reduce jitter in the measurement. |
| Engineering Unit | In many cases it is the same as the measurement unit however the measurement unit can be rescaled into a user unit that more closely represents the process being measured. |
| Engineering Min | Minimum process value that corresponds to the minimum measured unit value. |
| Engineering Max | Maximum process value that corresponds to the maximum measured unit value. |
| Input Type | Standard = Input is measured between the input and return terminals. Differential = Input is the difference between two measured values. |
| Action | Direct = The output rises from minimum to maximum as the input rises from minimum to maximum. Reverse = The output falls from maximum to minimum to as the input rises from minimum to maximum. |
| Signal Limits | When available HIGH and LOW limits can be set over the entire output signal range. |
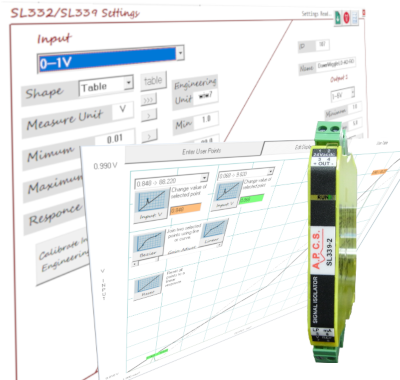
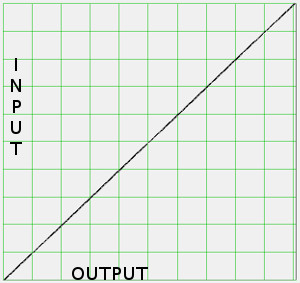
Shape-Linearisation
Standard signal isolators produce a linear input to output response. This means that when plotting output against input on a line chart the result would be a straight line. The SL300 software plots input on the vertical axis and output on the horizontal axis.
Many measurement applications require the input output response to be tailored to correct errors in the measured signal. The SL series uses industry standard calculations to create 101 point tables over the measurement range you select when you select a standard probe on the input drop down list.
This facility is also available on the generic measurement ranges for you to correct errors in unusual probes or errors in your process parameter measurements. Creating a table for your use you will typically follow a three step process.
- Set Table Scale Input to Output
- Create Table From Ten Known Points
- Edit Individual Points and Plot Between Points
Shape - Linearisation
Set Input to Output Scale
First create a user specified range to define the input and output of the table.
- Select the measurement unit.
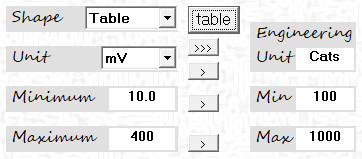
Scale Input to Output
- Set the min and max measurement range. (Measurement = 10 to 400mV)
- Set the min and max engineering unit and range. (Engineering = 100 to 1000 Cats Later when selecting the output range it should be related to the Cats measurement).
- Select the shape as Table
If selection is set to linear when you press Program or save your table will be replaced with a straight line. If you press Read your table will be replaced by the content in the connected module.
- Click the table button to edit the points.
- The resulting user table has a horizontal axis is broken up into 101 equally spaced points that represent the engineering output of 100 to 1000 Cats.
- The vertical axis represents the input value in measurement units.
- The output point values cannot be changed, the input measurement to produce the output value is changed. Each progressive input value MUST be greater than the last.
- A user table is usually entered in two steps
- Create Table From up to Ten Known Points.
- Edit Individual Points and Plot Between Points.
Create Table From up to Ten Known Points
As the output is divided into 101 evenly spaced points it makes it difficult to enter known correct input and output values as they will seldom be the same as one of the fixed output positions.
The program has a screen to enter up to ten points manually or pasted
from a spread sheet. Only ten rows may be pasted. Output values cannot
be duplicated.
All values must increase in value.
- Open the Input Table screen click on Enter User Points.
- Enter the User Input and User Output Values or paste from a spread sheet. Do not include the first and last fixed points in your paste selection.
- Click Calculate 101 step data . 101 input and output points data will be generated and plotted on the graph.
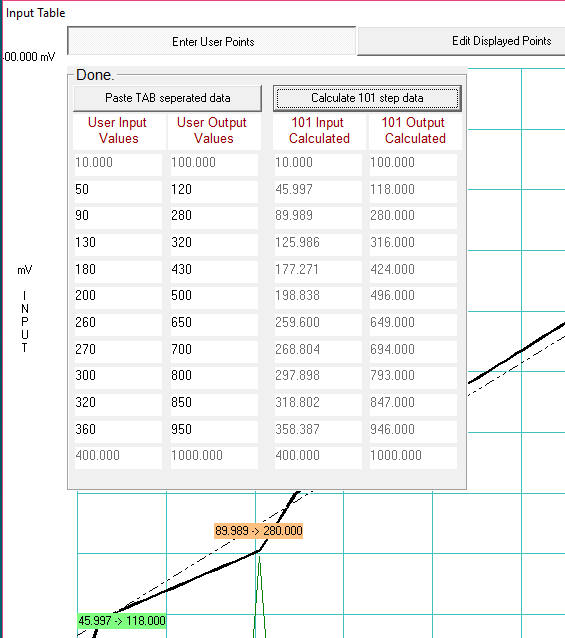
Calculate 101 Step Data
Edit Displayed Points
Editing of each input point is accomplished by clicking on the chart or selecting the from the drop down lists. Two drop down lists enable the selection of two points at once which then can then be joined either as a straight line or using the simple bezier function to curve above or below average using the bezier gain slider.
- Click on Edit Displayed Points.
- Select two points using the two drop down list boxes.
I have selected two points from the drop downs
Point 1: Input: 216.700 (mV) Output: 541 (Cats)
Point 2: Input: 271.456 (mV) Output: 703 (Cats)
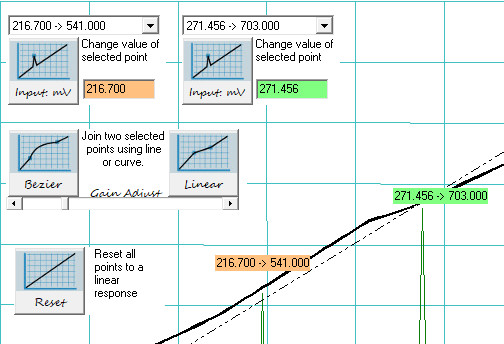
Two points from the drop downs
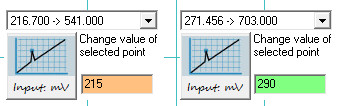
Change Input Values
- Change the input values in associated input boxes.
Point 1: Input: 215 (mV) Output: 541 (Cats) Point 2: Input: 290 (mV) Output: 703 (Cats)
- After changing the values click the associated update button, values will be written into the point list, updated in the input box and on the chart.
The values will not be exactly the same as what you entered but will be within 0.01% of the original value.
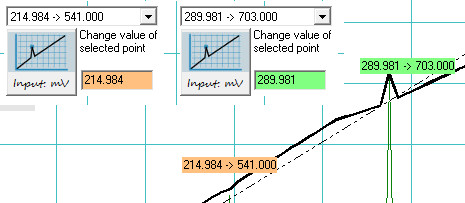
After Changing Values
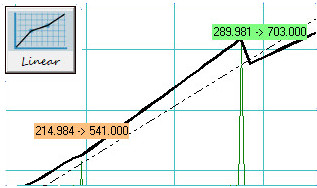
Linear Join
- With two points still selected I can the press Linear join button, the resulting section of curve looks like a saw tooth
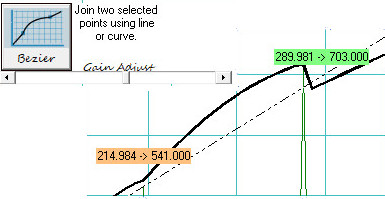
- Leaving the same two points selected pressing the Bezier join button a smooth curve can be created with a positive negative shape by adjusting the gain slider
- It can be seen that all 99 user points can be adjusted by repeating steps 1 to 6 as necessary.
Bezier Join
Linearise a Falling Signal
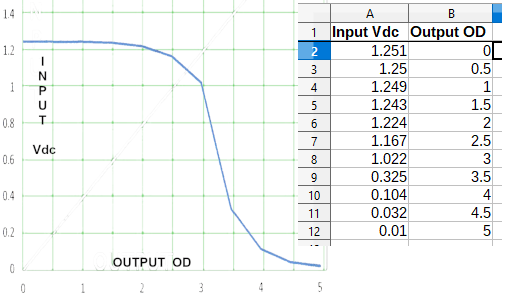
Linearise a Falling Signal
The SL300 software plots input on the vertical axis and output on the horizontal axis. The horizontal axis will always break the output range into 101 equally spaced output points.
The input value each of these known points is tailored to correct errors in the measured signal. Each input value MUST be >= the previous value, this means that a reverse acting or rising input to falling output cannot be directly plotted.
New Article
SL300 v2 Programmer Setup
Please refer to SL300 Install to download.